Introduction
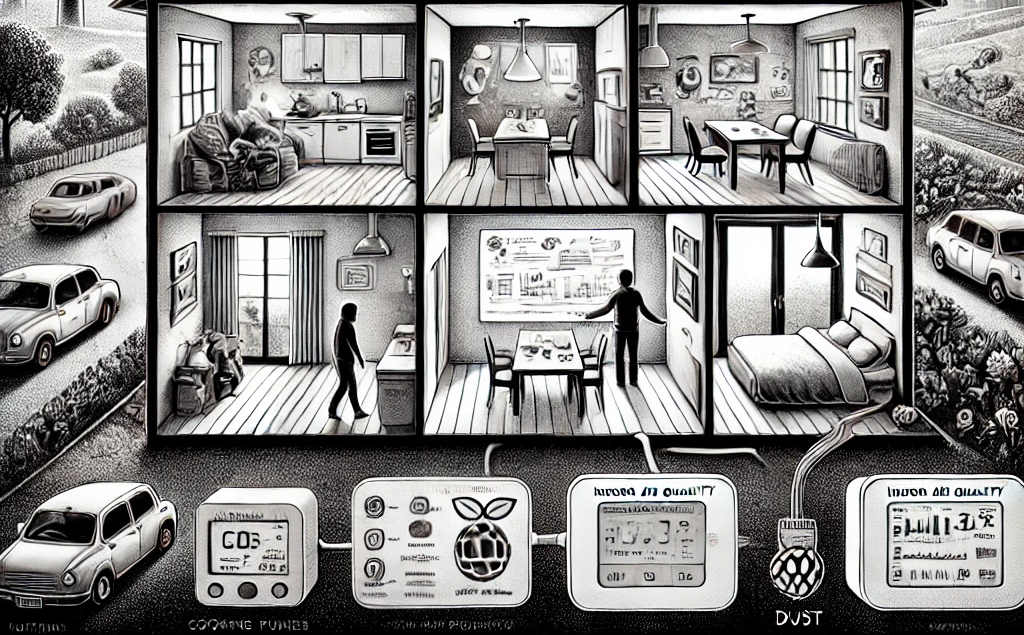
In Europe, we typically spend most of our time indoors and most of this time in our homes REFS. While indoors, we are exposed to the indoor environment, which can have both positive and negative impacts for occupant comfort, well-being and physical health REFS.
The indoor environment is often refered to using the broad term ‘indoor environmental quality’ (IEQ) which encompasses the acoustic, thermal, visual and air quality components of the indoor environment. Humans can sense certain aspects of IEQ, but this varies across different people and different components of IEQ – experienced IEQ is subjective and highly variable REFS.
Ventilation is the exchange of air between indoors and outdoors REFS. This exchange of air can alter IEQ and occupant exposure to IEQ and therefore, ventilation can indirectly have implications for occupant health REFS. However, ventilation can also have implications for space conditioning and increase space conditioning energy consumption and carbon emissions REFS. Ventilation therefore lies at the nexus of energy, health and the climate.
The interactions between occupant exposure, the indoor and outdoor environments and ventilation are dynamic, context specific and highly variable REFS. Due to this, it is challenging to provide simple rule based advice which would universally apply to all.
Measurements of IEQ can allow occupants to objectively assess the quality of IEQ and adjust their behaviours to manage their exposure. Similarly, measurements of ventilation can allow occupants to evaluate the interactions between ventilation, IEQ and energy. In addition to providing information to occupants, measurements of IEQ and ventilation can facilitate research into ventilation and IEQ and their relationships. However, measurements of IEQ and ventilation are not trivial and measurement platforms can be complex and expensive.
Initially my interests were to learn more about the sensors and IEQ measurements, but after prototyping a number of reliable platforms, I went about improving them.
I wanted to build a simple and transparent platform that could reliably measure temperature, humidity and carbon dioxide with good accuracy and be cheap. I also wanted a platform that can be extended to include other sensors (e.g., particulate matter, VOCs and others) in the future.
The main goals of the platform were:
- ‘Good’ accuracy and precision (what does good mean?)
- Simple
- Transparent
- Cheap (as possible)
- Reliable
- Scaleable
Platform selection
There are many choices of platform available on which to base the design, but the decision was an easy one for me personally. I am familiar with Python and Raspberry Pi, so that was that. Raspberry Pi’s are a small single board computer, that allow a physical platform that can run code and interface with a large range of electronic devices and sensors.
Raspberry Pi are very capable devices, particularly for IOT sensor platforms and have been widely used by other researchers who have developed sensor platforms for research REFS
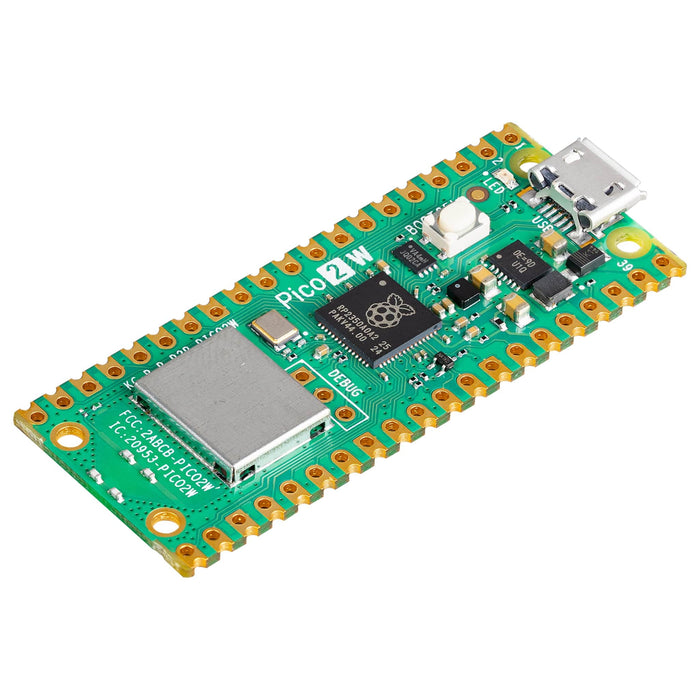
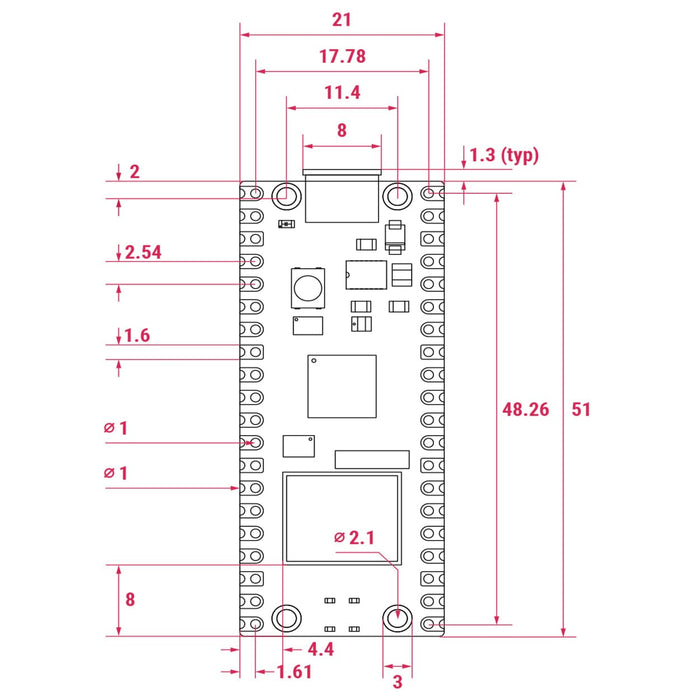
There is a wide selection of Raspberry Pi’s to choose from and all are very capable for IEQ platforms, but there is a wide range of cost. One of the cheapest options is the Raspberry Pi Pico 2W, which has a small form and has built in WiFi – only £6.60 (incl VAT). However, it is a microcontroller with only 2MB of flash memory and has limited space for storing data. The Pi Pico has I2C providing a bus coms facility that is compatible with many sensors.
Sensor selection
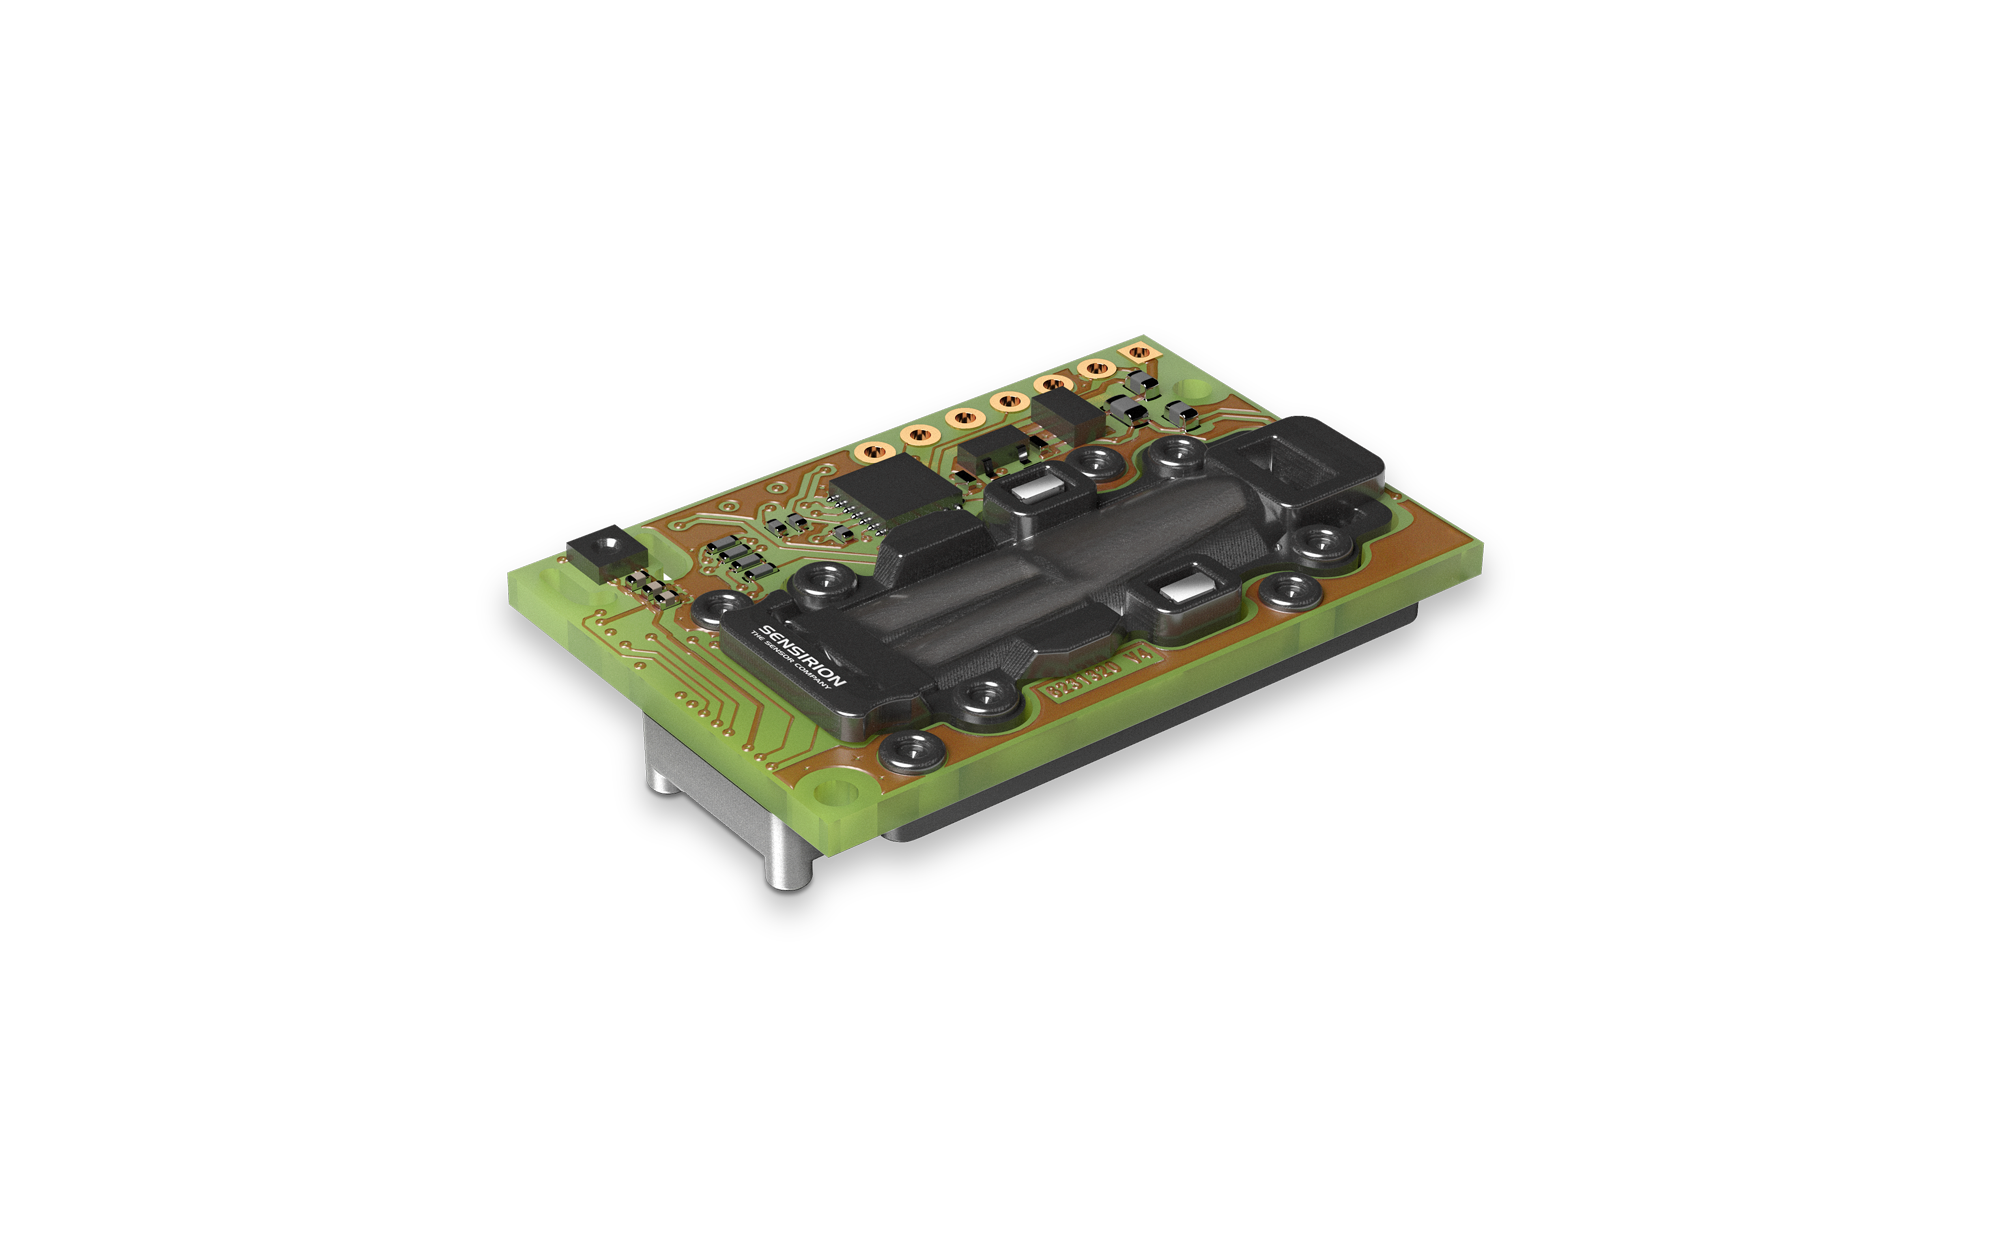
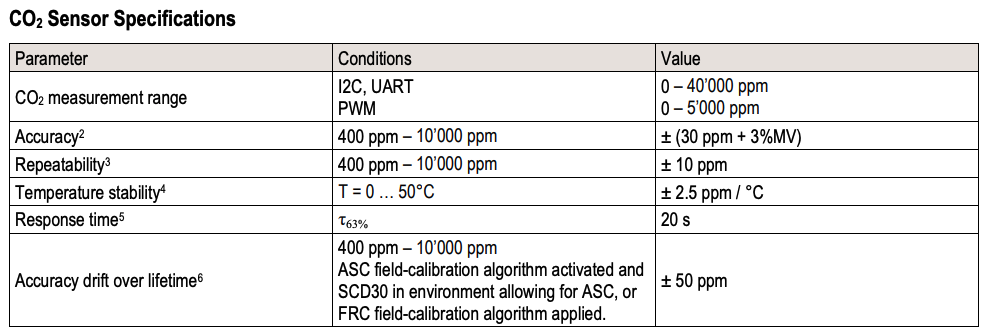
To begin with, I wanted the platform to have the capability of measuring temperature, relative humidity and carbon dioxide. The focus of version 1 is quality CO2 measurements. Throughout my PhD I had worked extensively with Sensirion SCD-30 sensors, which are a mid- to high-quality temperature, RH and CO2 sensor. These sensors feature heavily in IEQ/IAQ research REFS.
The CO2 sensor in the SCD-30 is a quality NDIR sensor.
The manufacturers specifications for temperature, humidity and CO2 are very comparable with other quality instruments that are widely used in research REFS. Better than most and up there with the best.


Version 0
Version 0 was a proof of concept, built on breadboard. Initially I used the Raspberry Pi Zero, as I could SSH and fault find code etc. I purchased the Adafruit SCD-30, as this offered a simple interface between Pi and SCD-30 – however, this alone cost £58.70. It worked reliably for months recording to its own on board storage and had a WLAN accessible data dashboard. I added a particle counter and installed this in a sustainably sourced bamboo case that I laser cut. I gifted this to my primary PhD supervisor.

Version 1
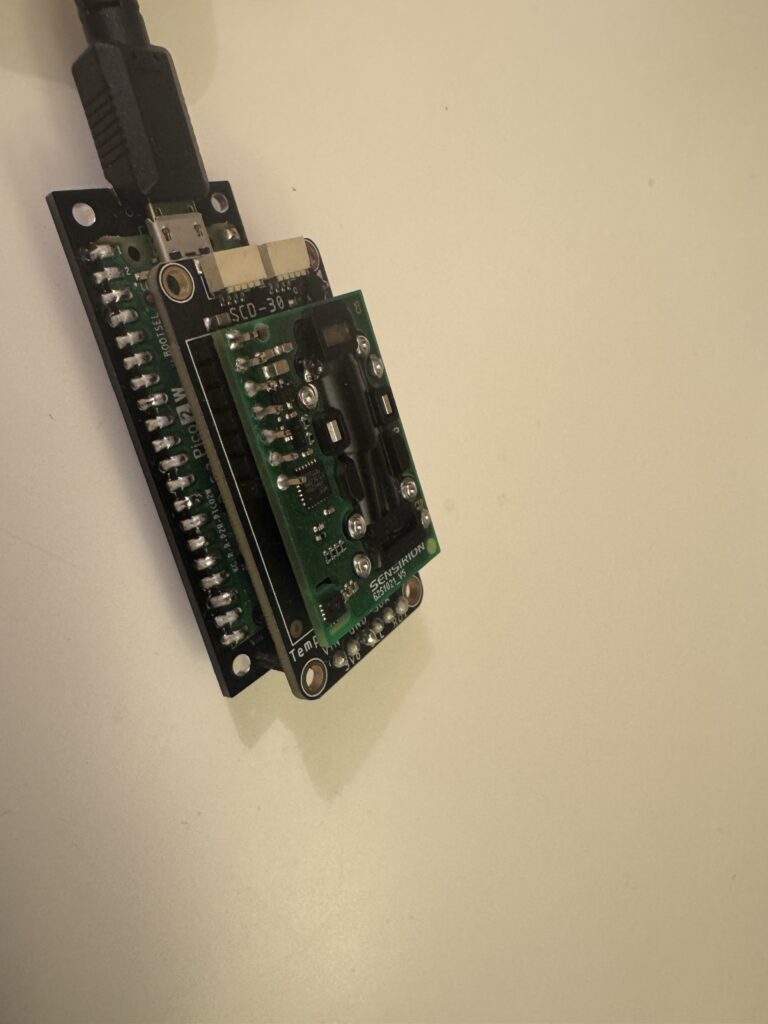
Version 1 is the current working version. This uses a Raspberry Pi Pico 2W (£6.60 incl VAT excl postage) and the Adafruit SCD-30 (£58.70 incl VAT excl postage) with a custom PCB I designed (5 for around $10 incl VAT and postage).
Version 1 cost each is around £70 – version 2 is (potentially) much cheaper.
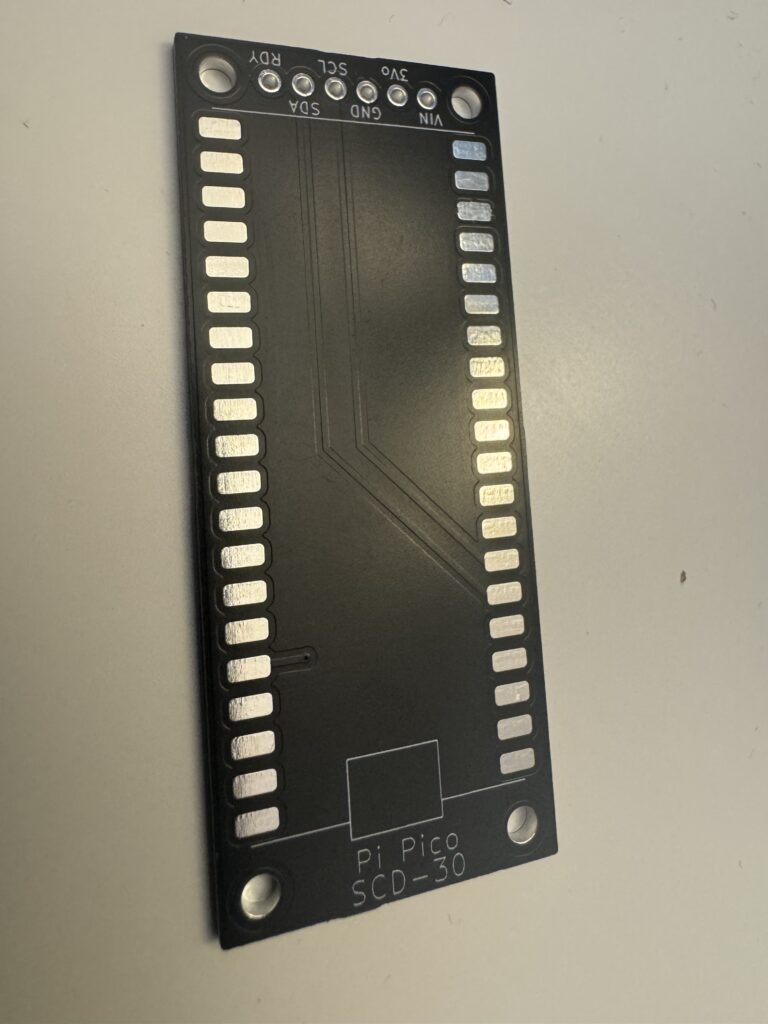
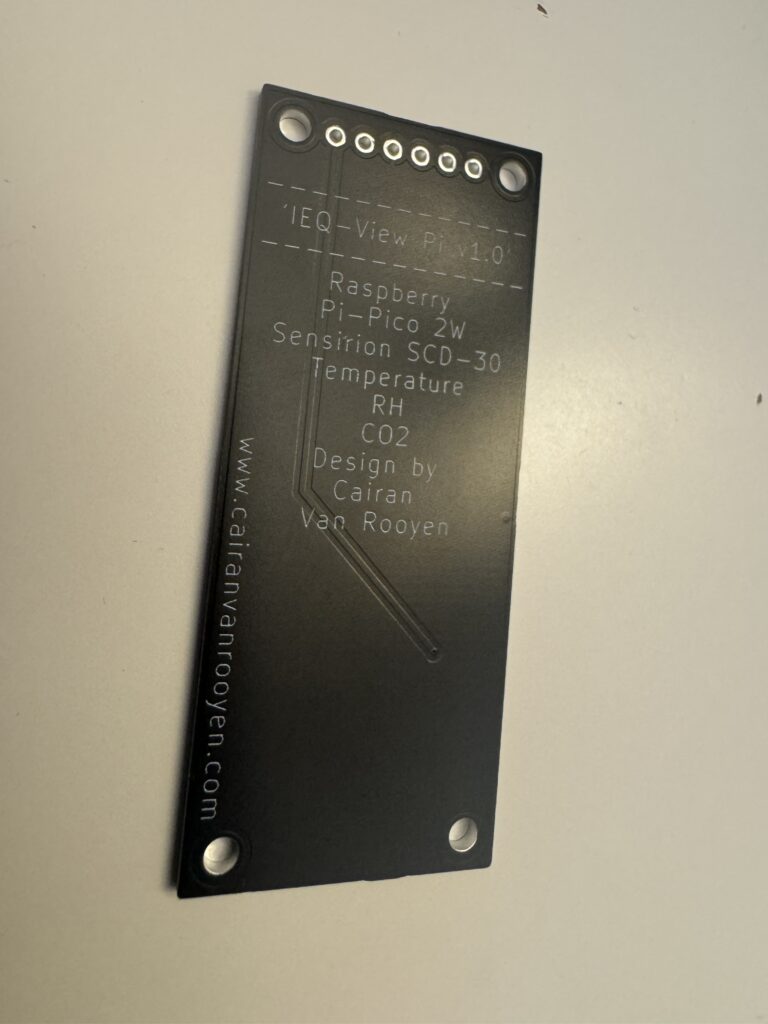
The code is based on CircuitPython and runs a very simple script, which:
- Initialises sensors
- Connects to WiFi
- Every 5 minutes: reads sensors and posts this data to my virtual private server (this webpage is running on my VPS).
To see data from this platform ‘live’ (every 5 minutes) see this page. Note: this might not show any data, as the sensor is packed up for my move to Switzerland.
The data is stored on a fully featured InfluxDB 2.0 database, which is free software developed specifically for timeseries data. It is brilliant to use for time-series data.
I use Grafana to produce interactive realtime graphs on my website.
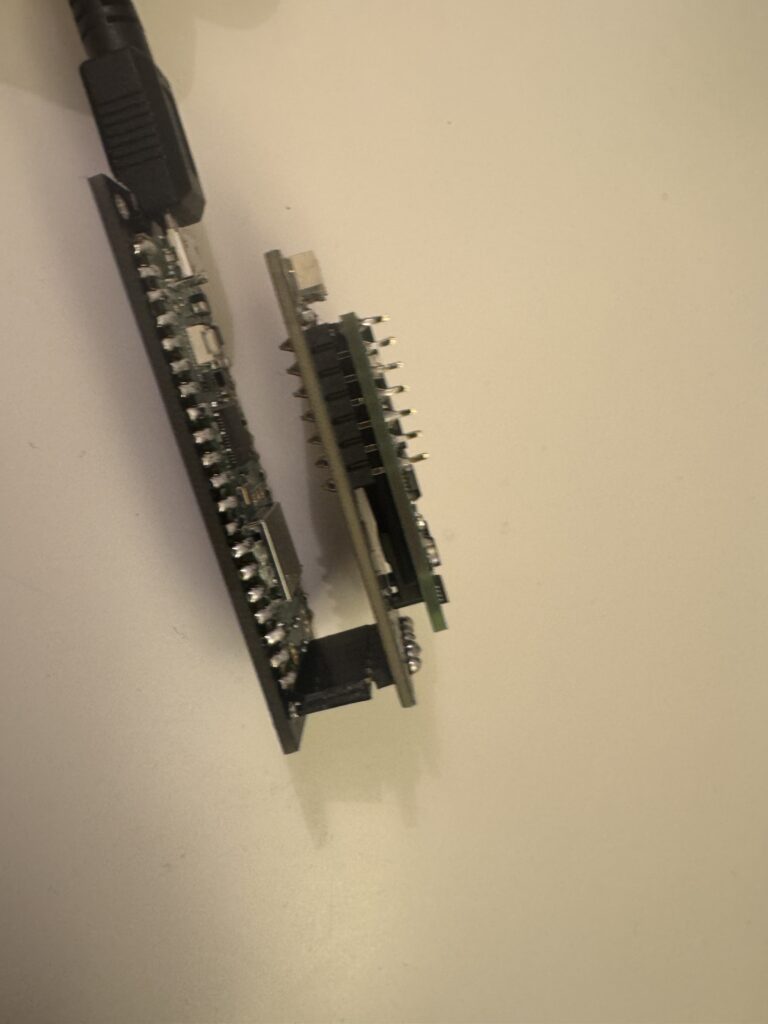
Issues and lessons learned:
- No mechanical protection and SCD-30 is vulnerable and flimsy.
- No secondary power (only Micro USB).
- Need to shave microUSB plastic case to fit onto PCB – need to modify PCB design.
- Light on Adafruit SCD-30 is bright at night.
Version 2
Improvements:
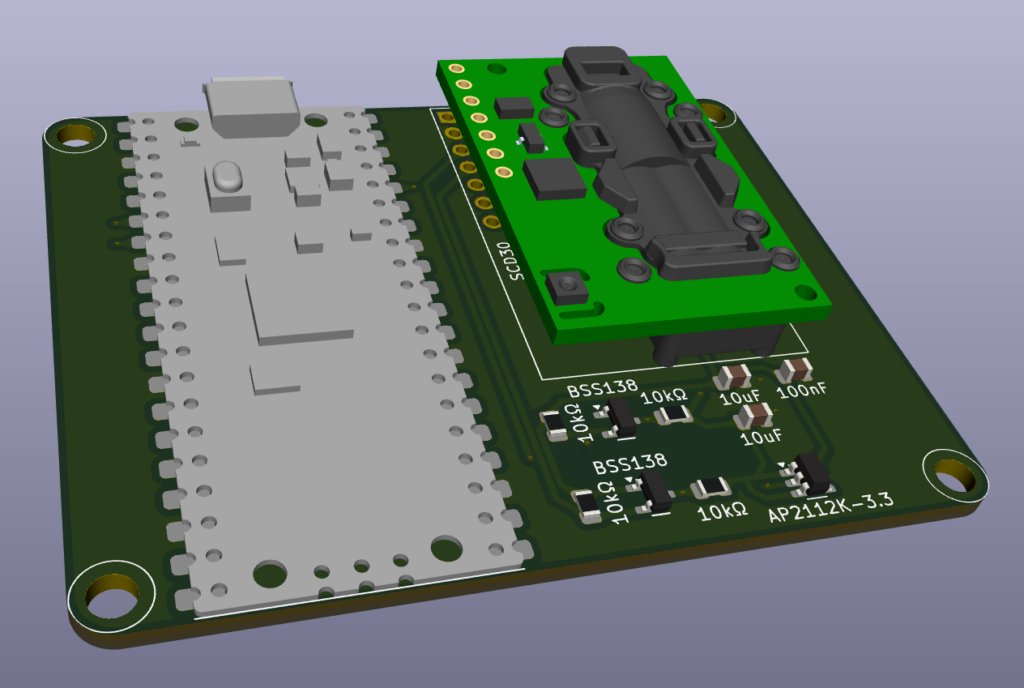
- USB micro can connect without modifying the connector.
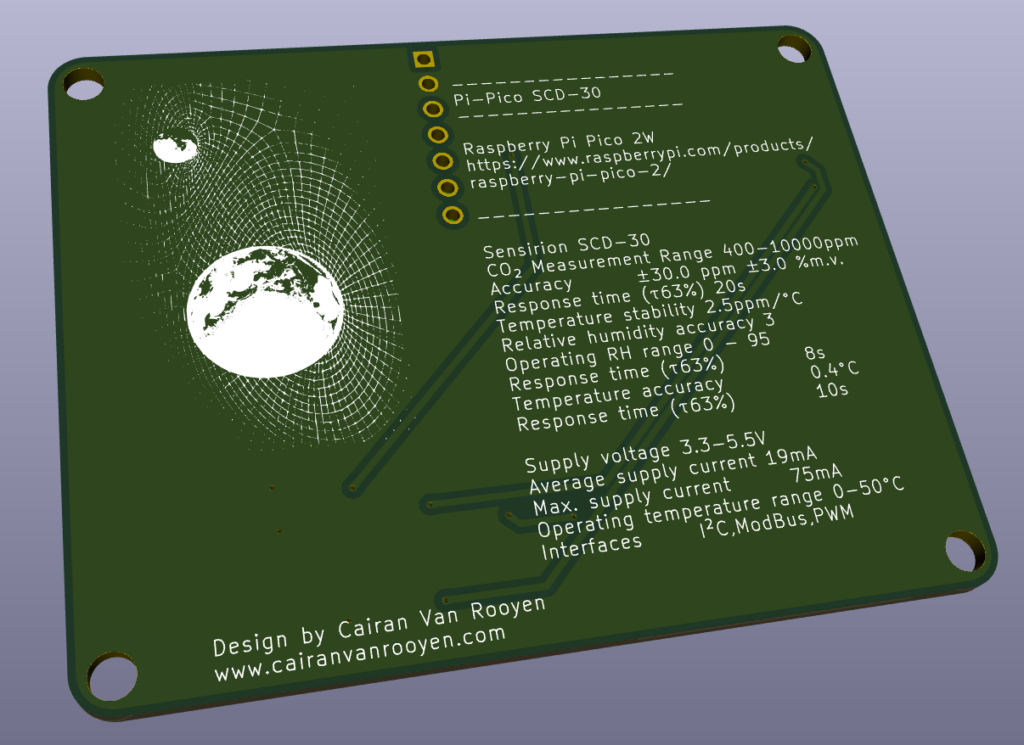
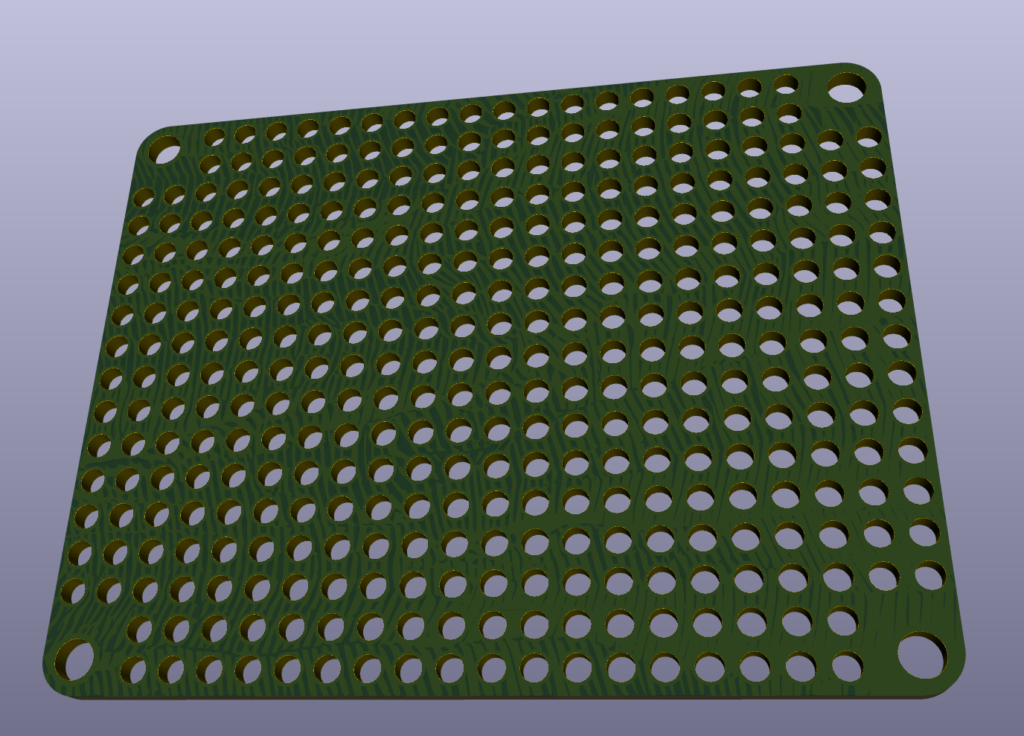
- SCD and Pico mounted on one PCB, with a second perforated panel mounted with stand-offs above the first. The second is a 1.6mm (copper reinforced) perforated ‘panel’ and the standoffs should provide good mechanical protection to the SCD, whilst still allowing air movement.
- I have reverse engineered the Adafruit device and designed my own power, pull-ups and shifts based on the Adafruit solution. This means that I can buy the SCD-30 on its own which is much cheaper! £25.40 vs £58.70.
To do:
- Ability to power from a second power – not only microUSB. Think many and many of these devices 🙂
- Maybe flip Pico through 180degrees – power from bottom. Check SCD-30 mounting instructions.
I think v2 should cost around £50ish (including all postage).
Future ideas and todo
If i want to run loads of these in a single space/house i might need to think about the possibility of having a logger (e.g., Pi 5) with comms to each of the Pico sensors by LoRaWAN or RF. The concern is that many of these could block comms to the VPS, unless I can figure out a very quick and efficient post code, which is also possible.
Code needs refinement to include error handling. E.g., if post fails, delay and try again.
More sensors – PM (easy), electrochemical sesnsors.
Think about more processing power and storage on VPS.
Code automation on server.
