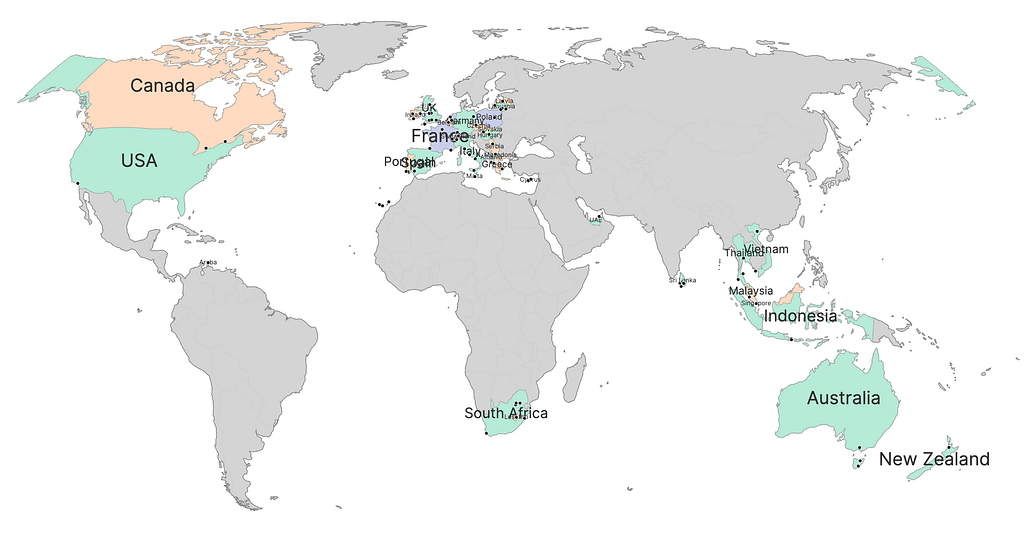
I coded a digital scratch map with Python, Plotly, and a generous amount of help from Claude. The idea was to create a simple tool that takes a list of cities you’ve visited and generates an interactive world map where those countries show up in colour. The result is a standalone HTML file you can open in any browser or host on your personal website. Visited countries show up in colour on an otherwise monochrome world. Small dots mark the cities. You can zoom, pan, and hover to explore.
The concept is simple. You maintain a JSON file with the cities you’ve visited:
[
    "London, United Kingdom",
    "Paris, France",
    "Cape Town, South Africa",
    "Bali, Indonesia",
    "Toronto, Canada"
]
Run a Python script. Out pops a single HTML file with an interactive world map. Countries you’ve been to are filled in with colour. Countries you haven’t are a clean, muted grey. City dots appear where you’ve been.
No accounts. No subscriptions. No app. Just a file you can open in a browser or drop on your personal site.
How It Works
The script does five things in order.
Load your cities —It reads from a `cities.json` file. Nothing fancy — just an array of strings in “City, Country” format.
Geocode everything —Each city gets sent to OpenStreetMap’s Nominatim API to look up coordinates and the country’s ISO code. This is the slowest part on the first run, since the API has rate limits. But results are cached in a `.geocache.json` file, so subsequent runs are nearly instant. The geocoder returns latitude, longitude, and — critically — the country’s two-letter ISO code. Plotly needs three-letter ISO codes to draw its choropleth, so a mapping dictionary handles the conversion.
Figure out which countries you’ve visited — Once every city has been geocoded, the script collects the unique set of countries. If you’ve been to London, Edinburgh, and Manchester, that’s one country: the United Kingdom. If you’ve been to Pisa, Rome, and Sicily, that’s one country: Italy. The cities list drives everything.
Colour the countries (without clashes) — The script uses graph colouring to ensure that no two adjacent visited countries share the same colour. If you’ve been to France and Spain, they’ll always be different colours.It works by modelling country borders as a graph. Each visited country is a node. If two visited countries share a land border, they’re connected by an edge. Then a greedy colouring algorithm walks through the nodes and assigns the first colour from the palette that none of its already-coloured neighbours are using. The border data is a hand-curated adjacency list covering every land border on Earth plus a few notable close neighbours (like the UK and France via the Channel Tunnel). It’s stored as a static Python dictionary — no external data files needed.
Build the map — The map itself is a Plotly figure with three layers: (1) A choropleth layer that fills visited countries with their assigned colours, (2) Text annotations that place each country’s name at its geographic centroid, with font sizes scaled to the country’s physical extent, and (3) Scatter markers for each city — small dark dots that show the city name on hover. Unvisited countries stay a neutral light grey. The ocean is white. There’s no title, no legend, no clutter. Just the map. The output is a single HTML file that loads Plotly from a CDN. It’s lightweight, self-contained, and works anywhere.
Because a standalone HTML file belongs to you. It doesn’t depend on a service that might shut down, a subscription you might cancel, or an API that might change its terms. It’s a file on your computer that you can open in twenty years and it’ll still work.