
Abstract: Poor indoor air quality affects our comfort, cognitive performance, well-being and physical health, yet we do not possess the senses to objectively evaluate if the environment we are exposed to is healthy or not. Many IAQ monitors are expensive, lack transparency and key measurements. PiAQ democratises air quality monitoring through a scalable DIY platform built around a Raspberry Pi Zero 2 W and quality Sensirion sensors. For approximately £87, anyone can build a good quality monitor measuring CO₂, particulate matter (PM1.0/2.5/4/10), VOC, NOx, temperature, and humidity — all compliant with RESET® and WELL Building Standard™ requirements. No soldering or specialist tools are required thanks to plug-and-play STEMMA QT connectors. The device features a real-time OLED display and optional cloud telemetry via MQTT, InfluxDB, and Grafana.
Disclaimer: This project is intended for educational purposes only, as the device is not certified or calibrated. If you decide to use this for health-related decision-making, you do so at your own risk. Please pay attention to the limitations and discussion below. The author assumes no liability for any harm or damage resulting from the use of this device.
This story was written with assistance from Claude Opus 4.6, an AI language model developed by Anthropic. The author is solely responsible for the content, design, and implementation of the project.*
GitHub repository: https://github.com/cairanvanrooyen/piaq
1. Introduction
1.1 What is indoor environmental quality (IEQ) and why does it matter?
We spend most of our time indoors — with many of us in Europe spending over 95% of our time indoors. The indoor environment, also commonly referred to as indoor environmental quality (IEQ) is made up of various components, typically characterised into four broad components: 1 — the thermal environment, 2 — indoor air quality (IAQ), 3 — the visual environment and 4 — the acoustic environment. While we spend time indoors we are exposed to these four components of IEQ, which are important determinants of our comfort, cognitive performance, mental well being and physical health. However, the human body is not able to effectively detect and evaluate all components IEQ, particularly those components that affect our health. For example, carbon monoxide is a colourless, odourless gas that can cause sudden illness and death at high concentrations, yet we have no sensory mechanism to detect it. Similarly, we cannot directly perceive the concentration of carbon dioxide, particulate matter, or volatile organic compounds in the air we breathe. Further complicating our senses are that we can become habituated to poor indoor conditions over time, leading to a diminished perception of discomfort or health risk.
A key takeaway from this is that we cannot rely on our senses to evaluate the quality of the indoor environment we are exposed to, and therefore we are at risk of being exposed to unhealthy conditions without realising it. This is where objective measurement of IEQ becomes crucial. By using sensors to quantify IEQ parameters, we can gain actionable insights into the indoor environment and make informed decisions.
Commercial IAQ monitors exist but are typically either prohibitively expensive — particularly those employing non-dispersive infrared (NDIR) CO₂ sensors and laser-scattering particulate counters — or lack the measurement accuracy and range of variables required for meaningful health related insights. Furthermore, proprietary platforms frequently restrict data access and trap users into costly data plans. This restricts user autonomy, preventing users from controlling their own data, performing their own longitudinal analysis or integrating measurements into broader smart-home or research workflows.
This project addresses these limitations by presenting a fully open-source, solder-free IAQ monitoring platform that combines ‘good’ quality sensors with widely available single-board computing hardware. The total hardware cost is approximately **£87** (at late-2024 UK prices), placing this device within reach of individuals, citizen scientists, educators, and community health advocates. The platform is designed so that anyone — regardless of technical or coding experience — can assemble and deploy it.
1.2 What aspects of IEQ to measure and why?
Understanding what to measure — and why — is essential. As discussed above, IEQ is a complex, multidimensional construct that encompasses a wide range of physical parameters that affect us humans in complicated ways and this impact varies with different people. The choice of which parameters to measure should be guided by their relevance to the users aim (e.g., health, comfort, productivity), their (potential) prevalence in the indoor environment that will be measured, and the economic and financial feasibility of accurate measurement with the proposed platform.
This project focuses on a few selected components of indoor environmental quality, namely: temperature, relative humidity, carbon dioxide (CO₂), particulate matter (PM₁.₀, PM₂.₅, PM₄, PM₁₀), volatile organic compounds (VOCs) and nitrogen oxides (NOx). These parameters were selected because they are important indicators of IEQ for health, but one must note that they are not the only important indicators of IEQ. For example, buildings can also have indoor sources of carbon monoxide, radon, formaldehyde, ozone, and other pollutants that can be harmful to health. This project provides a foundation for measuring IEQ using sensors that operate using the I²C protocol, and can be expanded in the future to include additional sensors for other parameters if desired.
Carbon Dioxide (CO₂) is a direct product of human respiration and serves as a proxy for ventilation adequacy and occupancy. While CO₂ itself is not toxic at typical indoor concentrations, research has reported measurable cognitive impairment with elevated concentrations. Outdoor ambient CO₂ is approximately 420 ppm; indoor concentrations in poorly ventilated occupied spaces routinely exceed 1,500–3,000 ppm.
Particulate Matter (PM₁.₀, PM₂.₅, PM₄, PM₁₀) is strongly associated with mortality and morbidity globally (WHO, 2021). Indoor sources include cooking (especially frying and grilling), combustion (candles, incense, wood-burning stoves), cleaning activities, and infiltration from outdoor air. PM₂.₅ particles are particularly hazardous because their diameter (< 2.5 µm) allows them to penetrate deep into the alveoli of the lungs and enter the bloodstream. The WHO 2021 guideline recommends a 24-hour mean PM₂.₅ concentration below 15 µg/m³ and an annual mean of below 5 µg/m³.
Volatile Organic Compounds (VOCs) are a broad class of carbon-based gases that readily vaporise at room temperature. Indoor VOC concentrations are typically 2–5 times higher than outdoors due to off-gassing from building materials, furniture, paints, adhesives, cleaning products, cosmetics, and cooking. Many VOCs — notably formaldehyde, benzene, and toluene — are classified as harmful or carcinogenic, although the majority of household VOCs (e.g., ethanol, limonene) are less hazardous at typical concentrations. Elevated total VOC levels are generally associated with poor ventilation and can indicate a need for increased fresh air supply. Note that the MOx sensor used in this platform provides a composite VOC Index rather than specific compound identification, so it serves as a general indicator of changes in the indoor gas composition rather than a precise measurement of individual VOCs. This means that the VOC index could both indicate the presence of harmful VOCs or simply reflect benign changes. Therefore, the VOC Index should be interpreted in context and not as a direct measure of health risk.
Nitrogen Oxides (NOx) — nitric oxide (NO) and nitrogen dioxide (NO₂) — are produced by combustion processes. Typical indoor sources include gas-powered stoves, gas boilers, fireplaces, candles, and cigarettes (Lin *et al.*, 2013). NOx gases are powerful irritants that harm the lungs and mucous membranes even at low concentrations. The WHO 2021 Air Quality Guidelines significantly lowered the recommended exposure limits for NO₂, recognising that long-term exposure at even small concentrations is associated with respiratory inflammation and asthma exacerbation. Unlike VOCs, NOx gases can persist in enclosed spaces for several hours. The NOx Index provided by the MOx sensor is a relative measure of changes in NOx levels rather than an absolute concentration, so it should be interpreted as an indicator of combustion-related pollution events rather than a precise measurement of NOx concentration. This means that the NOx Index can be useful for detecting when combustion activities are occurring (e.g., cooking, candle burning) but does not provide a direct measure of health risk without additional context.
Temperature and Relative Humidity are fundamental comfort and health related parameters that also influence pollutant behaviour and the risk of mould growth. High and low temperatures can cause thermal discomfort and exacerbate health conditions, while extreme temperatures can lead to heat stress or hypothermia. Temperature can also impair cognitive function and sleep quality, while relative humidity below 30% desiccates mucous membranes and above 60% promotes dust mite proliferation and mould growth (ASHRAE, 2020). Both parameters also affect the accuracy of gas-phase measurements and must be accounted for in sensor compensation algorithms.
1.3 What this device will NOT do
This device is designed to provide real-time measurements of selected IEQ parameters, but it is not a comprehensive environmental monitoring solution. As discussed above, it does not include sensors for other important health related parameters such as carbon monoxide, radon, formaldehyde, ozone, or noise levels. It also does not include any actuators or control systems for actively improving IEQ (e.g., ventilation fans, air purifiers). The platform is focused on measurement and data collection rather than intervention. As discussed above, it is important that any users are aware of the other limitations associated with the measurements from this platform, and that they do not rely solely on this platform for health related decision making.
1.4 How to measure IEQ
The platform employs different sensing technologies:
Non-Dispersive Infrared (NDIR) — CO₂ Measurement (SCD30)
The SCD30 measures CO₂ concentration using NDIR spectroscopy, which exploits the fact that CO₂ molecules absorb infrared light at a characteristic wavelength (~4.26 µm). An infrared source emits broadband radiation through a measurement chamber containing the ambient air sample. A wavelength-selective optical filter and photodetector at the far end measure the attenuation of the 4.26 µm band. The degree of attenuation is proportional to the CO₂ concentration in the air. The SCD30 employs a dual-channel design: a reference channel at a wavelength not absorbed by CO₂ provides continuous compensation for optical degradation (lamp ageing, mirror contamination), enabling greater long-term stability without frequent recalibration (Sensirion, 2020). This is a direct, physically selective measurement — the sensor responds specifically to CO₂ and not to other gases.
Laser-Scattering Photometry — Particulate Matter Measurement (SEN55)
The SEN55 measures airborne particulate matter using a laser-scattering optical particle counter (OPC). A small fan draws ambient air through a measurement chamber where particles intersect a focused laser beam. Each particle scatters light, which is detected by a photodiode. The intensity and angular distribution of the scattered light are used to estimate the particle’s size (via Mie scattering theory), while the pulse rate indicates particle concentration. The sensor classifies particles into size bins (PM1.0, PM2.5, PM4, PM10) and reports mass concentrations in µg/m³ derived from the particle count distribution using an assumed density model (Sensirion, 2023a).
Metal-Oxide (MOx) Gas Sensing — VOC and NOx Measurement (SEN55)
The SEN55 contains a heated metal-oxide semiconductor element for gas-phase measurements. The MOx surface changes its electrical resistance in response to the oxygen content on its surface: reducing gases such as VOCs consume oxygen during catalytic combustion on the heated surface, decreasing the resistance, while oxidising gases such as NOx provide additional oxygen, increasing the resistance (Sensirion, MOx Sensor Application Note). The sensor is inherently broadband — it reacts to most changes in gas composition but cannot identify individual compounds. This is a critical distinction: the sensor indicates that the gas composition has changed, not what specific gases*are present. On-chip humidity compensation (using Sensirion’s integrated SHTxx humidity sensor) corrects for the confounding influence of water vapour, which also acts as a reducing gas on the MOx surface.
The raw MOx resistance signals are processed by Sensirion’s proprietary Gas Index Algorithm, which converts them into VOC Index (1–500) and NOx Index (1–500) outputs. These indices describe the current gas conditions relative to the sensor’s recent history using a 24-hour moving average as the baseline. The VOC Index maps the baseline to 100: values above 100 indicate elevated VOC levels relative to the average (e.g., from cooking or cleaning), while values below 100 indicate improved conditions (e.g., after opening a window). The NOx Index maps its baseline to 1, reflecting the fact that NOx is typically present only during active combustion events (Sensirion, 2023b; Sensirion, 2023c). It is important to note that this is a relative measure of changes in the indoor gas composition rather than a precise measurement of individual VOC or NOx concentrations, and should be interpreted as an indicator of changes in indoor air quality rather than a direct measure of health risk.
1.5 Aims and Objectives
The aims of this project are to:
2. Hardware
2.1 System Architecture
The platform is built around three core subsystems connected via the I²C serial bus:
┌─────────────────────────────────────────────────────────────────┐
│                     Raspberry Pi Zero 2 W                       │
│                   (ARM Cortex-A53, 512 MB RAM)                  │
│                                                                 │
│   I²C Bus (SCL/SDA)                                             │
│       ├── SEN55-SDN-T  (PM1.0/2.5/4/10, VOC, NOx, T, RH)        │
│       ├── SCD30        (NDIR CO₂, T, RH)                        │
│       └── SSD1306      (128×64 OLED display)                    │
│                                                                 │
│   Network (Wi-Fi 802.11 b/g/n)                                  │
│       └── MQTT → VPS (InfluxDB + Grafana)                       │
└─────────────────────────────────────────────────────────────────┘
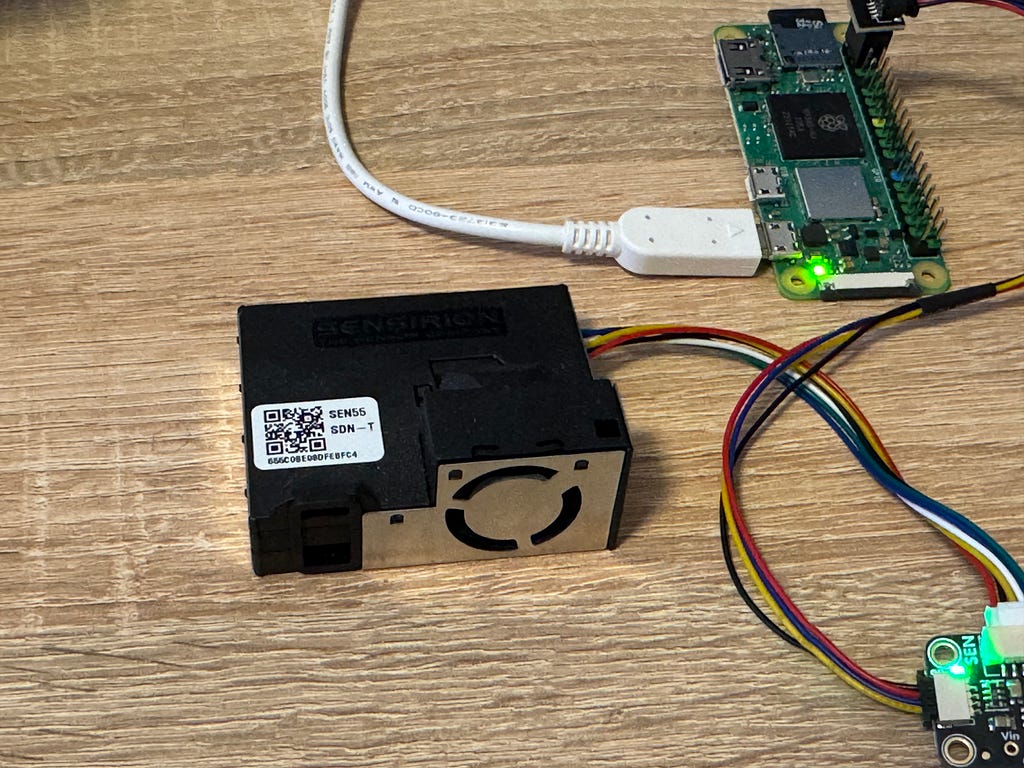
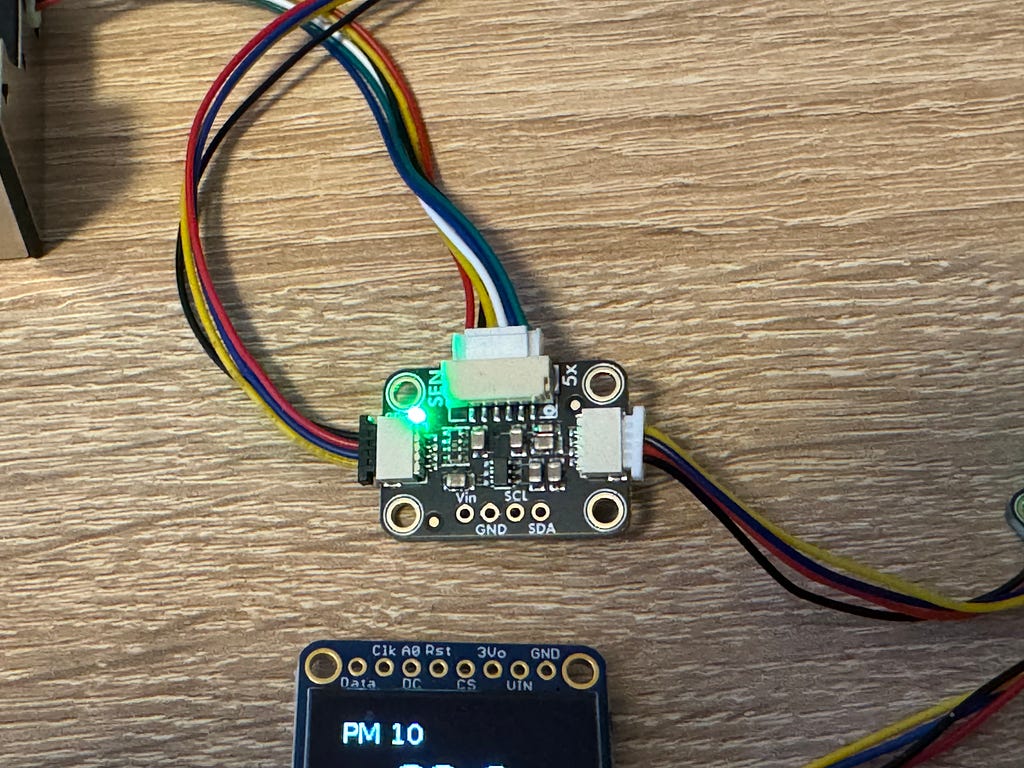
All sensor and display modules communicate with the Raspberry Pi over a shared I²C bus using [STEMMA QT / Qwiic](https://learn.adafruit.com/introducing-adafruit-stemma-qt) connectors, which provide a standardised 4-pin JST-SH interface for power (3.3 V), ground, SDA, and SCL. This connector ecosystem, originally developed by [SparkFun (Qwiic)](https://www.sparkfun.com/qwiic) and [Adafruit (STEMMA QT)](https://learn.adafruit.com/introducing-adafruit-stemma-qt), allows daisy-chaining of multiple I²C peripherals without soldering.
2.2 Components
The platform uses four hardware components. Full technical specifications are provided in Appendix A.
Sensirion SEN55-SDN-T — A multi-sensor environmental node that integrates five measurements: particulate matter (PM1.0, PM2.5, PM4, PM10 via laser-scattering photometry), VOC Index and NOx Index (via metal-oxide gas sensor), temperature, and relative humidity. The module is compliant with RESET® and WELL Building Standard™ requirements.
Sensirion SCD30 — A high-accuracy CO₂ sensor based on Sensirion’s patented CMOSens® non-dispersive infrared (NDIR) technology. The dual-channel optical design provides long-term stability. The module includes an integrated temperature and humidity sensor and supports automatic self-calibration (ASC), forced recalibration, and altitude/ambient pressure compensation. Suitable for compliance with EN 50543, RESET®, WELL Building Standard™, and California Title 24.

SSD1306 128×64 OLED Display — An Adafruit monochrome 0.96" OLED display using the Solomon Systech SSD1306 driver IC. Self-emissive technology (no backlight required), high contrast, and low power consumption. Communicates via I²C and cycles through real-time sensor readings.

Raspberry Pi Zero 2 W — The central processing unit. Quad-core ARM Cortex-A53 (1 GHz), 512 MB LPDDR2 SDRAM, 802.11 b/g/n Wi-Fi, 40-pin GPIO header with I²C support, powered via 5 V micro-USB.

2.3 Bill of Materials
All components were sourced from UK-based suppliers at late-2024 prices. Total cost: approximately £87 GBP.
3. Software
3.1 Overview
The software stack is entirely open-source and free. The application (`air_quality_monitor_improved.py` — [view on GitHub]) is written in Python 3 and runs on Raspberry Pi OS (Debian-based GNU/Linux). It performs four primary functions:
Software stack:
3.2 Application Architecture
The application is structured around two manager classes and a main event loop:
┌─────────────────────────────────────────────────────────┐
│                    main() Event Loop                    │
│                                                         │
│   ┌──────────────┐          ┌───────────────────────┐   │
│   │ MQTTManager  │          │   SensorManager       │   │
│   │              │          │                       │   │
│   │ • connect()  │          │ • initialize_i2c()    │   │
│   │ • publish()  │          │ • initialize_scd30()  │   │
│   │ • ensure_    │          │ • initialize_sen55()  │   │
│   │   connected()│          │ • initialize_display()│   │
│   │ • disconnect │          │ • read_sen55()        │   │
│   └──────────────┘          │ • read_scd30()        │   │
│                             │ • update_display()    │   │
│                             │ • check_sensor_health │   │
│                             │ • cleanup()           │   │
│                             └───────────────────────┘   │
└─────────────────────────────────────────────────────────┘
SensorManager encapsulates all hardware interaction. It initialises the I²C bus at 100 kHz, instantiates driver objects for each peripheral, and provides methods for reading sensor data with comprehensive error handling. Each sensor maintains an independent error counter; if a configurable threshold (MAX_SENSOR_ERRORS = 5) is exceeded, the manager automatically attempts reinitialisation of the failing device without disrupting other sensors or the main loop.
MQTTManager manages the connection lifecycle to the MQTT broker. It employs the paho-mqtt client library with background threading for non-blocking network I/O, automatic reconnection with configurable delay, and callback-based connection state tracking.
The main event loop executes the following sequence in each cycle:
3.3 Sensor Communication
Both sensors communicate via the I²C (Inter-Integrated Circuit) serial protocol. The Raspberry Pi’s hardware I²C peripheral on GPIO pins 2 (SDA) and 3 (SCL) connects to all three I²C devices on a shared bus, with each device addressed individually:
The SCD30 and SSD1306 use the Adafruit-Blinka abstraction layer, which maps CircuitPython’s board and busio APIs to Linux I²C device files (/dev/i2c-1). The SEN55 uses Sensirion’s own sensirion-i2c-driver with LinuxI2cTransceiver, which accesses /dev/i2c-1 directly. Both approaches coexist on the same physical bus.
Data from the SEN55 is accessed via `read_measured_values()`, which returns a structured object with typed fields (e.g., `mass_concentration_2p5.physical` returns PM₂.₅ in µg/m³ as a float). Data from the SCD30 is accessed via properties (`scd30.CO2`, `scd30.temperature`, `scd30.relative_humidity`). Both sensors provide a data-readiness flag that is polled before each read attempt.
3.4 OLED Display
The 128×64 OLED display cycles through seven measurement screens, each displayed for a configurable duration (5 seconds by default):

Each screen is rendered using the Python Imaging Library (Pillow) by creating a 1-bit monochrome image, drawing text with DejaVu Sans fonts (14 pt for labels, 24 pt bold for values), and pushing the framebuffer to the SSD1306 via I²C. The display label is positioned at the top, the measurement value is centred in the middle, and the unit is centred at the bottom.
3.5 MQTT Telemetry
Sensor data is published to a remote MQTT broker at a configurable interval (60 seconds). Each measurement is transmitted as an individual MQTT message in **InfluxDB line protocol** format:
<measurement_name>,device=<device_tag> value=<float_value>
For example:
scd30_co2,device=my_house value=1290.49
sen55_pm2_5,device=my_house value=34.30
sen55_voc_index,device=my_house value=186.00
This format enables direct ingestion by Telegraf’s MQTT consumer plugin into InfluxDB without additional transformation. The following eleven measurements are published per cycle:
3.6 Resilience and Error Handling
Deployment on a Raspberry Pi Zero 2 W — a resource-constrained device with 512 MB RAM — necessitates robust error handling, particularly for long-running unattended operation. The application implements the following resilience mechanisms:
4. Build Instructions
4.1 Hardware Assembly
Required tools: None. All connections are plug-and-play using STEMMA QT / Qwiic cables.
Estimated assembly time: 10–15 minutes.
Step 1: Prepare the Raspberry Pi Zero 2 W
Step 2: Connect the SCD30 CO₂ Sensor
Step 3: Connect the SEN55 Particulate Matter Sensor**
Step 4: Connect the OLED Display
Step 5: Power On
Note: The I²C daisy-chain topology means all STEMMA QT / Qwiic devices share the same bus. The order of connection does not matter, provided each device is connected to the chain.
4.2 Software Installation
4.2.1 Initial Raspberry Pi Configuration
1. Boot and connect to Wi-Fi. If using a pre-installed SD card, complete the first-boot setup wizard (set locale, connect to Wi-Fi, set password). If using Raspberry Pi Imager, configure Wi-Fi and SSH credentials before flashing. After booting, access the Pi via SSH, but you can also use a monitor and keyboard.
2. Enable I²C. Open a terminal and run:
sudo raspi-config
Navigate to Interface Options → I2C → Enable. Reboot when prompted.
3. Update the system:
sudo apt update && sudo apt upgrade -y
4. Install system dependencies:
sudo apt install -y python3-pip python3-venv python3-dev i2c-tools libopenjp2–7 fonts-dejavu-core
5. Verify I²C devices are detected:
sudo i2cdetect -y 1
You should see devices at addresses 0x3d (OLED), 0x61 (SCD30), and 0x69 (SEN55).
4.2.2 Python Environment Setup
1. Create a virtual environment:
mkdir -p ~/sensor_envs
python3 -m venv ~/sensor_envs/sen55_venv
source ~/sensor_envs/sen55_venv/bin/activate
2. Install Python dependencies:
pip install - upgrade pip
pip install adafruit-circuitpython-scd30
pip install adafruit-circuitpython-ssd1306
pip install sensirion-i2c-sen5x
pip install paho-mqtt
pip install Pillow
pip install adafruit-blinka
4.2.3 Deploy the Application
1. Copy the monitoring script to your home directory (download from the [GitHub repository]):
cp air_quality_monitor_improved.py ~/air_quality_monitor_improved.py
2. Edit the MQTT configuration in `air_quality_monitor_improved.py` to match your setup (or leave MQTT_BROKER empty to run in local-only mode without MQTT):
MQTT_BROKER = "<your-vps-ip>"
MQTT_PORT = 1883
MQTT_TOPIC = "sensors/<your-device-name>"
3. Test the application manually:
source ~/sensor_envs/sen55_venv/bin/activate
python3 ~/air_quality_monitor_improved.py
You should see sensor readings printed to the terminal and displayed on the OLED. Press Ctrl+C to stop.
4. Configure as a systemd service for automatic startup (download `setup_systemd_service.sh` from the repository):
sudo bash setup_systemd_service.sh
This script creates a systemd service file with the following configuration:
5. Start the service:
sudo systemctl start air-quality-monitor
6. Monitor the service:
# Check status
sudo systemctl status air-quality-monitor
# View live logs
sudo journalctl -u air-quality-monitor -f
# View application log file
tail -f ~/air_quality_monitor.log
4.3 Optional: VPS with InfluxDB and Grafana
This section describes how to set up a cloud-based data pipeline for remote monitoring, long-term storage, and visualisation of sensor data. This architecture enables monitoring from any device with a web browser and supports multiple IAQ sensor deployments reporting to a single dashboard. I have my own VPS running InfluxDB and Grafana, but you can use any cloud provider (e.g., Hetzner, DigitalOcean, Linode) or even a local server if preferred.
Contact me if you would potentially want to use my VPS for hosting your data.
Architecture:
RPi Zero 2 W                        VPS (Cloud Server)
┌──────────┐     MQTT (1883)     ┌──────────────────────┐
│ Sensor   │ ──────────────────► │ Telegraf             │
│ Monitor  │                     │   ├── MQTT Consumer  │
│          │                     │   └── InfluxDB Output│
└──────────┘                     │                      │
                                 │ InfluxDB             │
                                 │   └── Time-series DB │
                                 │                      │
                                 │ Grafana              │
                                 │   └── Dashboards     │
                                 └──────────────────────┘

5. Limitations
5.1 Platform Limitations
5.2 Measurement and Interpretation Limitations
1. VOC and NOx Index values are relative, not absolute concentrations. The Sensirion Gas Index Algorithm outputs unitless indices that describe the current gas conditions relative to a 24-hour moving average baseline. A VOC Index of 200 in one environment does not necessarily indicate the same VOC concentration as a VOC Index of 200 in another environment — each sensor adapts its gain based on its own recent history (Sensirion, 2023b). This means:
2. MOx sensors are semiquantitative and broadband. The underlying metal-oxide technology reacts to most changes in gas composition but cannot selectively measure individual compounds. Under field conditions, an equivalent VOC (etVOC) concentration output from a MOx sensor may deviate from the true total VOC (tVOC) value by a factor of two (−50%/+100%) or more (Sensirion, MOx Sensor Application Note). The VOC and NOx Index approach avoids this problem by reporting relative change rather than absolute concentration, but users should understand that the indices are indicators of air quality trends, not precise chemical measurements.
3. NOx Index baseline behaviour differs from VOC Index. The NOx Index maps its baseline to 1 (not 100), reflecting the fact that NOx is typically absent in clean indoor environments and appears only during combustion events. An NOx Index close to 1 indicates normal conditions, while values above ~20 suggest active combustion sources. Users should not directly compare the magnitude of the VOC and NOx indices.
4. SCD30 CO₂ accuracy is ±(30 ppm + 3% of measured value). This is perfectly adequate for indoor air quality and ventilation assessment. At 1,000 ppm, the total uncertainty is ±60 ppm; at 5,000 ppm, it is ±180 ppm.
5. Particulate matter measurements assume a standard particle density. The laser-scattering technique counts particles and infers mass concentrations using an assumed density model. Actual mass concentrations may differ from reported values if the aerosol composition deviates significantly from the calibration assumptions (e.g., dense mineral dust vs. light organic aerosol).
6. Temperature and humidity from the SEN55 may be biased by self-heating of the sensor module and proximity to the Raspberry Pi. The SCD30 provides an independent temperature/humidity measurement that can be used for cross-validation, but users should be aware that neither sensor is equivalent to a dedicated, aspirated temperature probe.
7. The platform does not measure all IAQ-relevant parameters. Notable omissions include formaldehyde (HCHO), carbon monoxide (CO), ozone (O₃), and radon (Rn). Each requires dedicated sensing technology not included in this design.
6. Future Work
7. Conclusions
This project provides a complete, reproducible recipe for building an indoor air quality monitor that measures CO₂, PM₁.₀/₂.₅/₄/₁₀, VOC, NOx, temperature, and relative humidity. By selecting sensors that comply with RESET® and WELL Building Standard™ requirements, employing a solder-free assembly approach, and releasing all software under open-source licences, the platform removes the principal barriers — cost, complexity, and accessibility — that prevent individuals from understanding the air quality in their indoor environments.
The optional cloud telemetry stack (MQTT, InfluxDB, Grafana) extends the platform’s utility beyond a standalone monitor to a connected sensing node suitable for long-term trend analysis, remote monitoring, and multi-site comparison. Together, these capabilities aim to empower individuals and communities to make informed decisions about ventilation, pollutant source control, and occupant health.
8. References
Adafruit (2019) *STEMMA and STEMMA QT*. Available at: https://learn.adafruit.com/introducing-adafruit-stemma-qt (Accessed: 15 January 2025).
Adafruit (2023) *Adafruit Monochrome 0.96" 128x64 OLED Graphic Display — STEMMA QT*. Available at: https://www.adafruit.com/product/326 (Accessed: 15 January 2025).
Allen, J.G., MacNaughton, P., Satish, U., Santanam, S., Vallarino, J. and Spengler, J.D. (2016) ‘Associations of cognitive function scores with carbon dioxide, ventilation, and volatile organic compound exposures in office workers: A controlled exposure study of green and conventional office environments’, *Environmental Health Perspectives*, 124(6), pp. 805–812. doi:10.1289/ehp.1510037.
ASHRAE (2020) *ANSI/ASHRAE Standard 55–2020: Thermal Environmental Conditions for Human Occupancy*. Atlanta: American Society of Heating, Refrigerating and Air-Conditioning Engineers.
Klepeis, N.E., Nelson, W.C., Ott, W.R., Robinson, J.P., Tsang, A.M., Switzer, P., Behar, J.V., Hern, S.C. and Engelmann, W.H. (2001) ‘The National Human Activity Pattern Survey (NHAPS): a resource for assessing exposure to environmental pollutants’, *Journal of Exposure Science & Environmental Epidemiology*, 11(3), pp. 231–252. doi:10.1038/sj.jea.7500165.
Lin, W., Brunekreef, B. and Gehring, U. (2013) ‘Meta-analysis of the effects of indoor nitrogen dioxide and gas cooking on asthma and wheeze in children’, *International Journal of Epidemiology*, 42(6), pp. 1724–1737. doi:10.1093/ije/dyt150.
Mainka, A. and Zajusz-Zubek, E. (2015) ‘Indoor air quality in urban and rural preschools in Upper Silesia, Poland: Particulate matter and carbon dioxide’, *International Journal of Environmental Research and Public Health*, 12(7), pp. 7697–7711. doi:10.3390/ijerph120707697.
Raspberry Pi Foundation (2021) *Raspberry Pi Zero 2 W*. Available at: https://www.raspberrypi.com/products/raspberry-pi-zero-2-w/ (Accessed: 15 January 2025).
Salthammer, T. (2022) ‘Emerging indoor pollutants’, *International Journal of Hygiene and Environmental Health*, 240, p. 113909. doi:10.1016/j.ijheh.2021.113909.
Satish, U., Mendell, M.J., Shekhar, K., Hotchi, T., Sullivan, D., Streufert, S. and Fisk, W.J. (2012) ‘Is CO₂ an indoor pollutant? Direct effects of low-to-moderate CO₂ concentrations on human decision-making performance’, *Environmental Health Perspectives*, 120(12), pp. 1671–1677. doi:10.1289/ehp.1104789.
Sensirion (2020) *SCD30 Sensor Module: Datasheet*. Stäfa: Sensirion AG. Available at: https://sensirion.com/resource/datasheet/scd30 (Accessed: 15 January 2025).
Sensirion (2023a) *SEN5x Datasheet*. Stäfa: Sensirion AG. Available at: https://sensirion.com/resource/datasheet/sen5x (Accessed: 15 January 2025).
Sensirion (2023b) *VOC Index for Indoor Air Applications*. Stäfa: Sensirion AG. Available at: https://sensirion.com/resource/application_note/voc_index (Accessed: 15 January 2025).
Sensirion (2023c) *NOx Index for Indoor Air Applications*. Stäfa: Sensirion AG. Available at: https://sensirion.com/resource/application_note/nox_index (Accessed: 15 January 2025).
Sensirion (n.d.) *What is a Metal Oxide (MOx) Sensor?* Stäfa: Sensirion AG. Available at: https://sensirion.com/resource/application_note/mox_sensor (Accessed: 15 January 2025).
Sensirion (n.d.) *PM Sensor Specification*. Stäfa: Sensirion AG. Available at: https://sensirion.com/resource/application_note/pm/sensor_specification (Accessed: 15 January 2025).
Sensirion (n.d.) *What are Oxidizing Gases?* Stäfa: Sensirion AG. Available at: https://sensirion.com/resource/application_note/oxidizing_gases (Accessed: 15 January 2025).
Sensirion (n.d.) *What are Reducing Gases?* Stäfa: Sensirion AG. Available at: https://sensirion.com/resource/application_note/reducing_gases (Accessed: 15 January 2025).
Sensirion (n.d.) *Is it Possible to Map the Output of a MOx Sensor to a Norm?* Stäfa: Sensirion AG.
SparkFun (2017) *Qwiic Connect System*. Available at: https://www.sparkfun.com/qwiic (Accessed: 15 January 2025).
WHO (2021) *WHO Global Air Quality Guidelines: Particulate Matter (PM2.5 and PM10), Ozone, Nitrogen Dioxide, Sulfur Dioxide and Carbon Monoxide*. Geneva: World Health Organization. ISBN 978–92–4–003422–8.
WHO (2022) *Household Air Pollution*. Available at: https://www.who.int/news-room/fact-sheets/detail/household-air-pollution-and-health (Accessed: 15 January 2025).
9. Licence
This project is released under the [MIT Licence](https://github.com/cairanvanrooyen/piaq/blob/main/LICENSE).
Third-party components retain their respective licences:
Appendix A: Sensor Technical Specifications
A.1 Sensirion SEN55-SDN-T — Environmental Sensor Node
Source: SEN5x Datasheet | Product Page
Particulate Matter
VOC Sensing
NOx Sensing
Temperature and Humidity
General
A.2 Sensirion SCD30 — NDIR CO₂ Sensor
Source: SCD30 Datasheet | Adafruit Product Page
CO₂
Temperature and Humidity
General
A.3 SSD1306–128×64 OLED Display
Source: Adafruit Product Page
A.4 Raspberry Pi Zero 2 W
Source: Raspberry Pi Foundation
Appendix B: Datasheet and Application Note Links
All datasheets and application notes referenced in this project are available directly from the manufacturers. PDF copies are also included in the datasheets/ directory of the Github repository.
Sensirion SEN55
Sensirion SCD30
SSD1306 OLED Display
Raspberry Pi
Raspberry Pi Zero 2 W — https://www.raspberrypi.com/products/raspberry-pi-zero-2-w/